Project 1 – Data Visualization for Decision-Making
Tools: Python (Pandas, Matplotlib, Seaborn), Jupyter Notebook
Description:
Designed dashboards and visual reports to analyze sales and customer behavior using a simulated dataset.
The project includes 50 video lessons and 50 Python scripts, each demonstrating a data visualization or analysis technique.
Key Results:
Clear visualization of KPIs: revenue trends, top products, and customer retention.
Improved decision-making support through interactive and well-documented charts.
Portfolio link: [GitHub Repository]
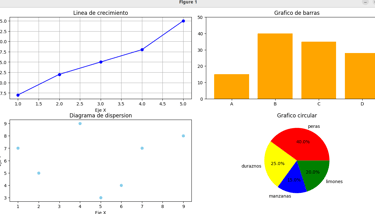
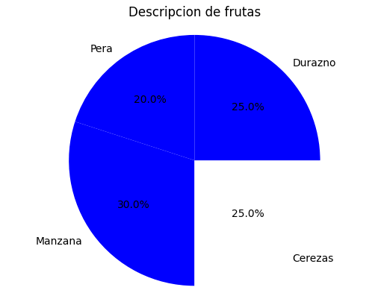
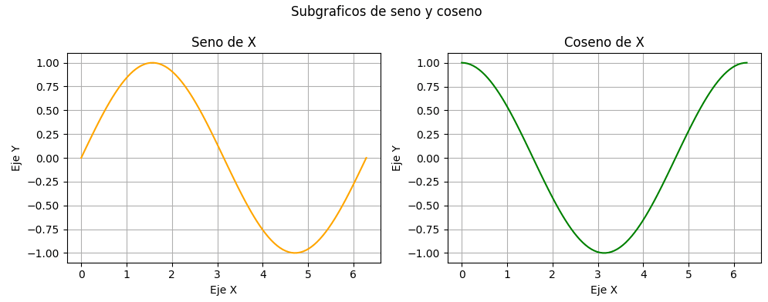
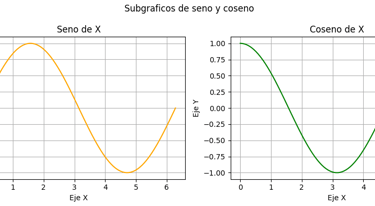
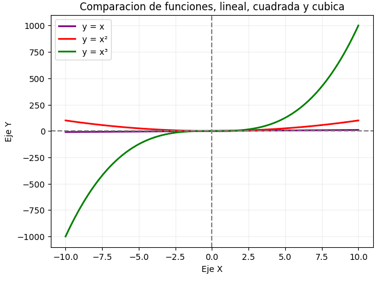
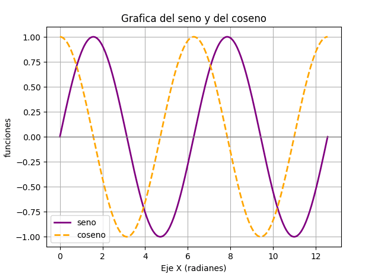
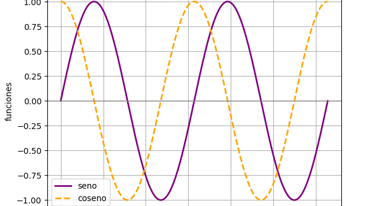
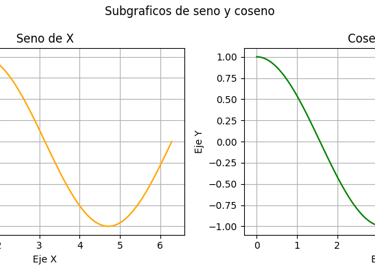
Gallery of the project